Getting started with R programming can be difficult, but it doesn't have to be. In this blog post - the first in a series, I show you the very first steps to learning R with confidence.
Better still, you can follow along by doing the course with me...
More...
Disclosure: we may earn an affiliate commission for purchases you make when using the links to products on this page. As an Amazon Affiliate we earn from qualifying purchases.
Getting Started With R - 2 Decades Ago!
Almost 2 decades ago (my, how old I've become) I was just starting my PhD and one of the resident statisticians, who was also doing her PhD - Janine - starting pestering me to learn R so I could do my statistics in R instead of in Excel or wherever.
I resisted, because I was just learning how to program in Matlab and Java, and just didn't have the time to learn how to program in R as well.
Pin it for later
Need to save this for later?
Pin it to your favourite board and you can get back to it when you're ready.
Getting Started With R - 1 Decade Ago!
Then I fast-forward about 8 years, and I was now an accomplished scientific programmer in Matlab, but I was unhappy at how slow it was. I was automating my statistical analyses and compressing a years worth of manual work into 2 weeks, but it was still 2 weeks. I was convinced that Matlab was slowing me down and I should be able to have all these analyses done in a much smaller time-frame. Maybe a day or less.
So I decided to give it another go and learn R programming.
Three days later and I gave up. For whatever reason (I can't remember the details), for the life of me I just couldn't get any data imported into R. And if you can't get data in, you can't even get started. I figured that 3 days was long enough struggling on one problem, so I went back to Matlab.
Getting Started With R - Today!
Now we fast-forward another dozen years and a friend of mine, Matt Dancho - more on him later - persuaded me to try again, but this time by taking his course on learning R programming for data science.
As I was doing this I decided that I would document my progress in a series of blog posts, but if you don't want to wait for me to go through everything why not check out Matt's course now?
This is the first of several posts on learning R (I don't know how many yet - I've only just started), and I hope you'll come along with me on this wild and wacky journey.
I have no idea where it will take me, and no idea what I will learn, but I'm excited to get started!
First Steps
OK, so all I have to do is install R and R-Studio and I'm away. Easy, right?
Unfortunately not. R-Studio wouldn't install, something about my PC being too old. It's only 15 years old, it's got at least another 30 years left in it. The bloody cheek!
So I asked Matt in the course comments if there's another IDE he would recommend instead. Within less than a minute he tells me to use R-Studio Cloud instead.
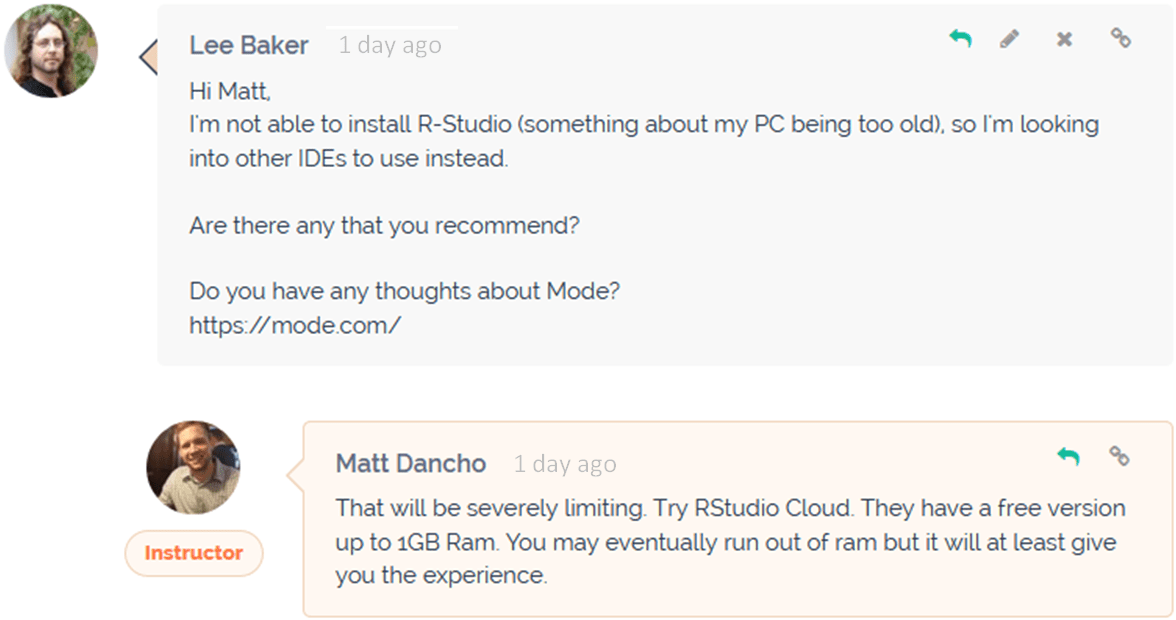
Wow - I expected to wait at least a day before I heard back from him!
Unlike R-Studio, you don't install R-Studio Cloud, you run it directly from within your browser, so it worked straight away with no issues.
Hey, look at me - I'm getting started with R!
Importing Tidyverse & Other Data Packages
From here, Matt took me through installing the R project for the course, installing all the packages I need, and basically getting used to the interface and moving around.
So far, so good...
One important thing to note is that I needed to install the Tidyverse package. This is a collection of R packages designed for Data Science, including packages for:
OK, so I've done that, but I haven't actually done anything with data yet. This is the next step where I get to *gulp* import some data - my nemesis!
Importing Data Using Tidyverse
Here's where I start to roll my eyes and go 'yeah - it only took me 3 days last time and I still couldn't do it'. Two minutes later and I had used the tidyverse function 'readxl' to import data into R from Excel and had assigned the data table to a variable in the workspace environment.
Two minutes - and this includes following along on the video and waiting for each step in the explanation!
After this I imported another couple of Excel files in about 5 seconds. Easy!
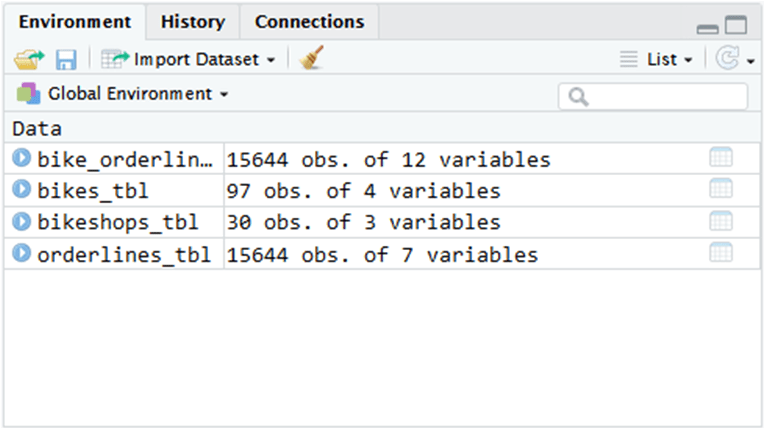
In fairness, when I tried to do this several years ago, neither RStudio nor tidyverse existed - you had to write the code yourself, and I couldn't figure out how to do it. Now it's so simple!
Having said that, it would have taken me quite some time to figure out how to do it if I didn't have Matt showing me every step, but still - it only took me 2 minutes to learn and do!
As a programmer in other languages I'm no stranger to coding and IDEs, but my first impressions of learning R, RStudio and the tidyverse are positive - I'm understanding everything and I'm making good progress, even though it is the early stages.
Joining Data in R
Now that I've got 3 data tables into R, they need to be joined together so I can query them and extract data subsets that I need to analyse.
Here's where I have to cast my mind back a long, long time to SQL.
Now, if you're a young Data Sciencer you probably raised an eyebrow at that statement. 'How can you be a Data Scientist if you've not done SQL for years?' I hear you cry...
Well, the answer is that I worked as a medical statistician for several years and everyone brought me their data in a single Excel spreadsheet - I haven't done SQL for years because I haven't needed to.
So there! *blows raspberry*.
Anyway, Matt showed me how to do a left-join in R using the imaginatively titled 'left_join' function, and I joined together the three tables so that I could query them and extract the data that I need.
*Bosh!*
Getting Started With R Programming For Data Science #datascience #rstats #tidyverse @eelrekab @chi2innovations
Next Steps - Pipes
As Matt is explaining how to join tables together he introduces me to something called Pipes so that I could use that to join the tables together.
Pipes is something that is (probably) unique to R, and is a way of creating a sequence of multiple operations.
In the past I've had to create sequences of operations, but Pipes totally blew me away!
So much so that I'm saving this for the next blog post in the series - if you want to know why Pipes are so amazing, join me in the next enthralling episode!
Check Out The Course
If you're interested in learning R programming for business and follow along with me in this blog series, coding as you go, I highly recommend that you check out Matt's course. It's called Business Analysis With R, and you can check it out below.
with Matt Dancho
All posts in the series:

