Statistical hypothesis testing can be a daunting task.
It can feel like there are hundreds of hypothesis tests that you could choose from, and many of them you’ve never heard of. It can take years of learning and practice before you get comfortable with statistical hypothesis testing, and knowing when and how to choose the right statistical hypothesis test is no mean feat.
Fortunately, there are ways to shortcut this by having a process, a useful list of hypothesis testing steps and a nice, big statistical test flow chart that you can use to choose the correct statistical test to use in your research.
Here I'm going to give you all three!
More...
Disclosure: This post contains affiliate links. This means that if you click one of the links and make a purchase we may receive a small commission at no extra cost to you. As an Amazon Associate we may earn an affiliate commission for purchases you make when using the links in this page.
You can find further details in our TCs
To get started, I’ll explain what statistical hypothesis testing is, and give you a few statistical hypothesis testing examples.
I’ll explain how you write a good hypothesis, giving you 3 different ways to do it, and I’ll show you the difference between a scientific hypothesis and a statistical hypothesis.
You’ll learn that there are 2 types of statistical hypothesis – Null and Alternative hypotheses, and I’ll explain the difference between them.
Finally, I’ll give you an incredibly useful statistical test flow chart – The Hypothesis Wheel – that will help you in choosing a statistical test for your study, along with the 4 hypothesis testing steps you’ll need along the way.
This post forms part of a series on the 4 types of data in statistics.
For more detail, choose from the options below:
4 Types of Data in Statistics: Introduction
Statistical Hypothesis Testing - Introductory Video
To help you get a good start and as an introduction to this post, I've prepared a short video.
You don't need to have watched the video to understand the post, but it will get your thinking in the right place. Once you've watched it, you'll find there is a lot more detail within the post.
Enjoy!
What Is Statistical Hypothesis Testing?
The main purpose of statistics is to test, by observation or experiment, a hypothesis (idea, hunch or educated guess) about something in the world around you.
Statistical hypothesis testing is the use of data to decide between two or more different possibilities to resolve an unknown or uncertain issue. For example, you might want to run an experiment to find out whether a new medicine is effective at treating headaches, compared to a placebo.
Statistical hypothesis testing produces a definite decision about which of the possibilities, based on the data gathered, is more likely to be correct, and is particularly powerful when the answer is not obvious from just glancing at the data.

Statistical Hypothesis Testing Examples
You can make a hypothesis about anything at all as long as you can put it to the test.
Typical statistical hypothesis testing examples might be:

Pin it for later
Need to save this for later?
Pin it to your favourite board and you can get back to it when you're ready.
How Do You Write A Good Hypothesis?
It is always a really good idea to write down your hypothesis. It’s not just good pratice, but it helps you to clarify what it is you’re trying to achieve.
Your hypothesis should be written as a statement, not a question, and is about the thing you are seeking to prove. Hypotheses are usually written in one of 3 ways:
- 1As an If-Then statement
- 2In terms of the relationship between variables
- 3As the difference between two or more comparison groups.

In statistics and science, many hypotheses are formed with a structure of:
“If I (do this) then (this will happen)”, for example:
Your hypothesis doesn’t have to fit this framework, though. Many hypotheses are phrased in terms of the relationship between a pair of variables, like these amazing hypotheses from some of the world’s greatest scientists:
If you are comparing two groups, your hypothesis can state the difference you expect to find between them, like this:
3 Simple Questions...
What's Stopping You Reaching
YOUR Data Ninja Potential?
Answer 3 questions and we'll recommend the best route to
super-charge your data career
What Is The Difference Between a Scientific Hypothesis and a Statistical Hypothesis?
A scientific hypothesis is a statement of what you believe will happen in your study, and is a proposed explanation (or prediction) of observed patterns or trends. You will then try to prove this hypothesis to be true or false by collecting and analysing data.
A statistical hypothesis, on the other hand, is a statement about whether a pattern or trend is present in the data. If the predicted trend is present, then you can state with a degree of confidence that there is evidence that the hypothesis may be correct.

For example, you might hypothesise that prolonged exposure to loud noise will increase systolic blood pressure.
Once you have your scientific hypothesis, you can state your statistical hypothesis and design your study accordingly to test whether it is true or false, by manipulating the amount of noise a person is exposed to and taking their blood pressure. Once you have collected your data you can analyse them to decide whether or not your scientific hypothesis was correct.
LEARN MORE ABOUT HYPOTHESIS TESTING WITH THESE BOOKS


2 Types of Statistical Hypothesis: Null and Alternative Hypotheses
Statistical tests are used to distinguish between the null hypothesis and one or more ‘alternative hypotheses’. In many cases, what you do is make a scientific hypothesis about whether something will happen, then try to prove it false by testing an opposing statistical hypothesis. If you fail to prove it false, then you have a basis for suggesting that your initial hypothesis may be correct. The statistical hypothesis that you try to prove false is called the Null Hypothesis.
The Null Hypothesis states that there is no pattern or trend in the data (e.g. there is no difference between groups, no relationship between two variables).
An Alternative Hypothesis is in direct contradiction to the null hypothesis, and states that there is a distinct pattern or trend in the data (e.g. there is a difference between groups, or a relationship between two variables). This is what you believe is true, and what you hope to prove.

Is it Possible to Prove a Null Hypothesis?
Statistics is the study of uncertainty, and everything in statistics is based upon this premise. As such, statistics can never definitively prove nor disprove anything.
What you can do, though, is make a statement on how confident you are, based on your results, that your conclusion is correct.
Although you can never be 0% or 100% sure that your result is correct, statistics gives you confidence that your methods are correct – if you repeat your experiment a number of times and keep getting the same (or similar) results, then your view of the world is broadly correct.
Statistical Hypothesis Testing: 4 Simple Steps (and a free chart) - Learn how the pros choose the correct test every time #statistics #datascience @chi2innovations
Statistical Hypothesis Testing - Getting Started
Knowing what statistical hypothesis testing is and how to do it are two different things!
One of the most important aspects of statistical hypothesis testing is choosing the correct statistical test, and that’s what this post is all about.
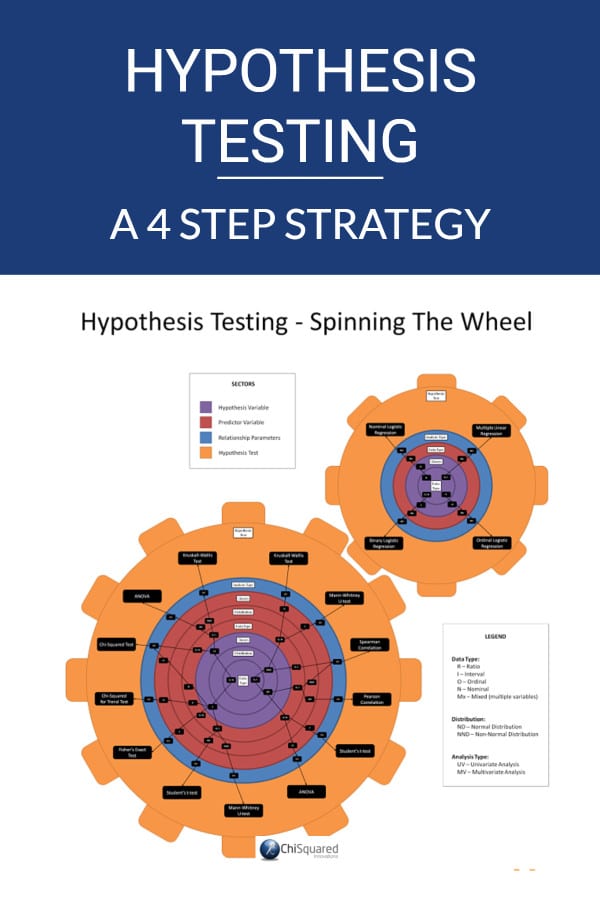
To help you in choosing the correct statistical test I've created a statistical test flow chart called The Hypothesis Wheel.
So without further ado, here it is – The Hypothesis Wheel – making its debut in the world:

Now, there's a HUGE amount of information in this statistical test flow chart, and I don't expect anyone to absorb it all with just a quick glance, so it will take you quite a bit of study time to get to grips with it all. This is why most people get confused when they dip their toes into the statistical hypothesis testing world!
We have an exclusive video course dedicated to teaching all of this in The Hive, but for now, let's have a look at the wheel to see how to 'read' it.
The Hypothesis Wheel Statistical Test Flow Chart - Free Download
To get the best out of this post you’ll need your own copy of The Hypothesis Wheel.
Below you can download and keep a Hi-Def pdf of The Hypothesis Wheel to help you in choosing the correct statistical test.
I suggest you download it now and refer to it throughout – it really will help you to take the next steps in choosing a statistical test for your study.
FREE Ultra-HD pdf Download
The Hypothesis Wheel

Learn how to choose the correct statistical hypothesis test every time
What Are The 4 Steps of Statistical Hypothesis Testing?
When making decisions about statistical hypothesis testing and deciding which statistical test to use, you need a plan of action, and here are my 4 hypothesis testing steps:
- 1Deduce the properties of your outcome variable (aka dependent or hypothesis variable)
- 2Deduce the properties of your input variable (aka independent or predictor variable)
- 3Deduce the parameters of the relationship
- 4Look up the statistic on The Hypothesis Wheel
That may sound complicated, but it’s actually easier than you might think.
Let’s go through each of the 4 hypothesis testing steps to learn how to decide which statistical test to use.
Hypothesis Testing Steps 1 & 2: Your Variable Properties
As you are doing the same thing in steps 1 and 2 you can do them together. The properties you need to check for your input and outcome variables are:
- 1Data Type
- 2Distribution
- 3Number of Classes
Data Type
I've previously written an in-depth post about data types, but it's worth briefly going over them again.
There are 4 distinct data types that you'll come across in your research, and they are Ratio (R), Interval (I), Ordinal (O) and Nominal (N).
Ratio and Interval data are quantitative data, also known as numerical data or continuous data.
In statistical hypothesis testing, there is no difference in how you treat Ratio and Interval data, so you don’t need to know how to distinguish between them.
You will, though, need to know the difference between Ordinal and Nominal data.
Ordinal data are qualitative data, organised in ordered categories, like Size: [Small, Medium, Large].
Nominal data are also qualitative data, organised in unordered categories, like Favourite Colour: [Red, Green, Blue].
Ratio, Interval, Ordinal and Nominal data are related like this:

Distribution
In terms of the distribution you need to check whether your data (Ratio or Interval data only) are normally-distributed (ND) or non-normally distributed (NND). Actually, all you really need to know is whether they are symmetrical or not - they don't need to be full-blown Gaussian distributions to qualify here.

If you’re not sure how to check whether your data are symmetrical, you can use the SKEW function in Excel. If the result is zero, your data are perfectly symmetrical, while positive values indicate that your distribution is skewed to the right (long tail on the right), and negative values indicate a left skew (long tail on the left).
Small values, whether positive or negative, are OK, and you can consider your data to be symmetrical.
There aren’t any defined cut-offs to tell you when your data are symmetrical or skewed, so it’s a by-eye judgement – you’ll need to run a few samples of data through the SKEW function to get a ‘feel’ for making decisions.
There are more powerful statistical measures of skewness and symmetricity, but this is the easiest to use and interpret.
Number of Classes
Finally, you need to check (Ordinal or Nominal only) how many classes (categories) there are in your data.
It's easier to explain what that means by example – the variable Gender has 2 classes; Male and Female, whereas My Favourite Colour Of The Rainbow has 7 (ROYGBIV).
What you really need to know to decide which statistical test to use is whether your variable has 2 classes or more than 2:

Once you’ve gathered together these pieces of information, you have all you need to choose the correct statistical test.
Hypothesis Testing Step 3: Relationship Parameters
The relationship parameter you need to know for the Hypothesis Wheel is which type of analysis you are conducting, univariate analysis or multivariate analysis, like this:

Hypothesis Testing Step 4: Look up Your Statistic on the Hypothesis Wheel
To help you navigate around the hypothesis wheel I've colour coded various parts of it, like this:

We always start in the centre with the properties of the hypothesis variable, coloured in purple. There are 3 concentric circles corresponding to Data Type, Distribution and Number of Classes.
Hypothesis Testing Step 1 – Hypothesis Variable:
- 1Data Type (RION)
- 2Distribution (ND or NND)
- 3Number of Classes (2 or >2)
Spinning further out, in red we have the properties of the predictor variable - again, there are 3 circles for Data Type, Distribution and Number of Classes.
Hypothesis Testing Step 2 – Predictor Variable:
- 1Data Type (RION)
- 2Distribution (ND or NND)
- 3Number of Classes (2 or >2)
Then we have a blue circle for the relationship parameters, which denotes whether our analysis is univariate (UV) or multivariate (MV).
Hypothesis Testing Step 3 – Relationship Parameters:
When you look closely you'll see that there are 2 hypothesis wheels, and the larger one contains only univariate hypothesis tests while the smaller one has only the multivariate hypothesis tests.
Finally, the outer orange circle tells us which hypothesis test we should choose in any given circumstance.
Hypothesis Testing Step 4 – Choosing the Correct Statistical Test
If you have followed each of the steps correctly, The Hypothesis Wheel will present you with the correct statistical test to use for your study.
Statistical Hypothesis Testing Example Using The Hypothesis Wheel
Let’s zoom in on a hypothesis testing example to see how you would use The Hypothesis Wheel to tell you which statistical test to use.
Let's say that your hypothesis variable has the following properties:
Step 1 – Hypothesis Variable:
And your predictor variable has these properties:
Step 2 – Predictor Variable:
You’re doing a pair-wise analysis between two variables, so this will be a univariate analysis:
Step 3 – Relationship Parameters:
Now let's see what that looks like on the hypothesis wheel:

Purple Segment: Starting from the centre, locate the data type of your hypothesis variable (Ordinal). It has more than 2 classes, so we locate that too.
Red Segment: Spinning out to the red segment, locate the data type of your predictor variable (Nominal). In this case, since the hypothesis variable has more than 2 classes it doesn't matter how many classes the predictor variable has.
Blue Segment: You are conducting a univariate analysis, so you should be checking the larger of the 2 Hypothesis Wheels and you should locate the entry of UV.
Orange Segment: This is where The Hypothesis Wheel reveals the correct statistical test to use for your study:
Step 4 – Choosing the Correct Statistical Test:
The Hypothesis Wheel – More Than Just Another Statistical Test Flow Chart
The Hypothesis Wheel is more than just another flow chart that helps you choose which statistical test to use. The world doesn’t need another statistical test flow chart, it needs a better one – and I believe this is it.
The Hypothesis Wheel is a framework for helping you to ask the right questions of your data so you can choose the correct statistical test every time. All you need to do is ask 3 questions to choose the correct statistical test:
- 1What are my data types (RION)?
- 2What are their distributions (ND, NND), and/or how many categories do they have (2, >2)?
- 3What types of analysis am I looking to perform (UV, MV)?
Once you’ve answered these questions – and they are right there on the chart to help you decide – The Hypothesis Wheel will help you choose which statistical test to use.
But this isn’t why it is a framework. It is a framework because if there is a statistical test that is not present on the chart (I’ve only included the most used in statistical hypothesis testing), it is really easy to see exactly where it should fit on The Hypothesis Wheel, like this:

For example, if you’re conducting a univariate analysis of paired continuous data that are both normally-distributed (or symmetrical), then you should be using a Paired t-test, and you can locate exactly where it should fit on The Hypothesis Wheel.
The Hypothesis Wheel Statistical Test Flow Chart - Free Download
If you haven't downloaded your copy of The Hypothesis Wheel yet, you can get your Hi-Def pdf copy right here:
FREE Ultra-HD pdf Download
The Hypothesis Wheel
Learn how to choose the correct statistical hypothesis test every time
Hypothesis Wheel Poster
If you'd quite like to have it stuck on your wall so you can refer to it whenever you need to (and add your favourite hypothesis tests to it), you can get a Hi-Def poster of The Hypothesis Wheel here:

Statistical Hypothesis Testing – Summary
For those that didn’t take a degree in statistics at University – around 99% of all those that need to use statistics in their work – statistical hypothesis testing can be a daunting task.
You need to choose the correct statistical test among a sea of possibilities, most of which you’ve probably never heard of.
What you need is a way to narrow the field, so you know which statistical test to use. Once you know that you can find out more about that statistical test so you can move on with your study.
The Hypothesis Wheel is a statistical test flow chart that gives you just 4 hypothesis testing steps to choosing the correct statistical test – first time, every time.
I hope that you find The Hypothesis Wheel to be useful in your research and that you will use it often.
Now that you know everything there is to know about choosing the correct statistical test, if you need a little refresher on the data basics you might also like to read this post's sister articles on quantitative data and qualitative data, Nominal data, Ordinal data, Interval data and Ratio data, and a comparison between each of the 4 types of data.
Do you have any questions about Statistical Hypothesis Testing and choosing the correct statistical test? Is there something that I've missed out?
Let me know in the comments below - your feedback will help me to improve the post and make learning about data and statistics easier for everybody!
This post forms part of a series on the 4 types of data in statistics.
For more detail, choose from the options below: